Kaup Index (Baby BMI): How to Calculate It and What's Normal by Age

Keep Every Growth Milestone
Get Started FreeYou plugged the numbers from your toddler's checkup into a Kaup index calculator and got 18. Is that too high? The Kaup index is simply weight in kilograms divided by height in meters squared, the same math as adult BMI. The catch is that a young child's BMI rises and falls a lot with age, so a single cutoff tells you very little. Here is how to calculate it and how to read it at each age.
💡 Kaup index = weight (kg) ÷ height (m) ÷ height (m). Under age 2, CDC recommends the WHO weight-for-length chart instead of BMI. From age 2, BMI is compared with children of the same age and sex: the 85th percentile and above is overweight, and the 95th percentile and above is obesity (CDC).What Is the Kaup Index? How to Calculate It
The Kaup index expresses in one number whether a child is heavy or light for their height. The formula is identical to adult BMI; "Kaup index" is the name commonly used for infant and toddler BMI, especially in Japan.
Formula
- Weight (kg) ÷ height (m) ÷ height (m)
- In pounds and inches: weight (lb) ÷ height (in) ÷ height (in) × 703
Example: an 18-month-old who is 80 cm (31.5 in) tall and weighs 10.5 kg (23.1 lb) has a Kaup index of 10.5 ÷ 0.8 ÷ 0.8, or about 16.4.
A Young Child's BMI Rises, Then Falls
Adults are judged against fixed BMI cutoffs, but children are not. CDC explains that because children are still growing, their BMI is expressed relative to others of the same sex and age.
Calculated from the World Health Organization (WHO) Child Growth Standards, the median BMI climbs from about 13.3 to 13.4 at birth to its peak around 6 months (17.3 for boys, 16.9 for girls). After that it drifts down, reaching about 15.2 for boys and 15.3 for girls by age 5.
| Age | Boys median (range) | Girls median (range) |
|---|---|---|
| 3 months | 16.9 (14.4 to 19.8) | 16.4 (13.7 to 19.4) |
| 6 months | 17.3 (14.9 to 20.3) | 16.9 (14.3 to 20.1) |
| 9 months | 17.2 (14.8 to 20.1) | 16.7 (14.2 to 19.9) |
| 12 months | 16.8 (14.5 to 19.6) | 16.4 (13.9 to 19.4) |
| 18 months | 16.1 (14.0 to 18.8) | 15.7 (13.4 to 18.6) |
| 24 months | 16.0 (13.9 to 18.7) | 15.7 (13.5 to 18.5) |
Calculated from the WHO BMI-for-age tables (LMS values). The range is the 3rd to 97th percentile, the band that holds 94 of every 100 children of that age. It is a reference, not a diagnostic cutoff.
So the same "18" means different things. At 6 months it sits a little above the middle (67th to 75th percentile) and is nothing to worry about, but at 18 months it is around 7th to 9th from the top of 100 children (91st to 93rd percentile). That is why one fixed chart of cutoffs fits babies and toddlers so poorly.
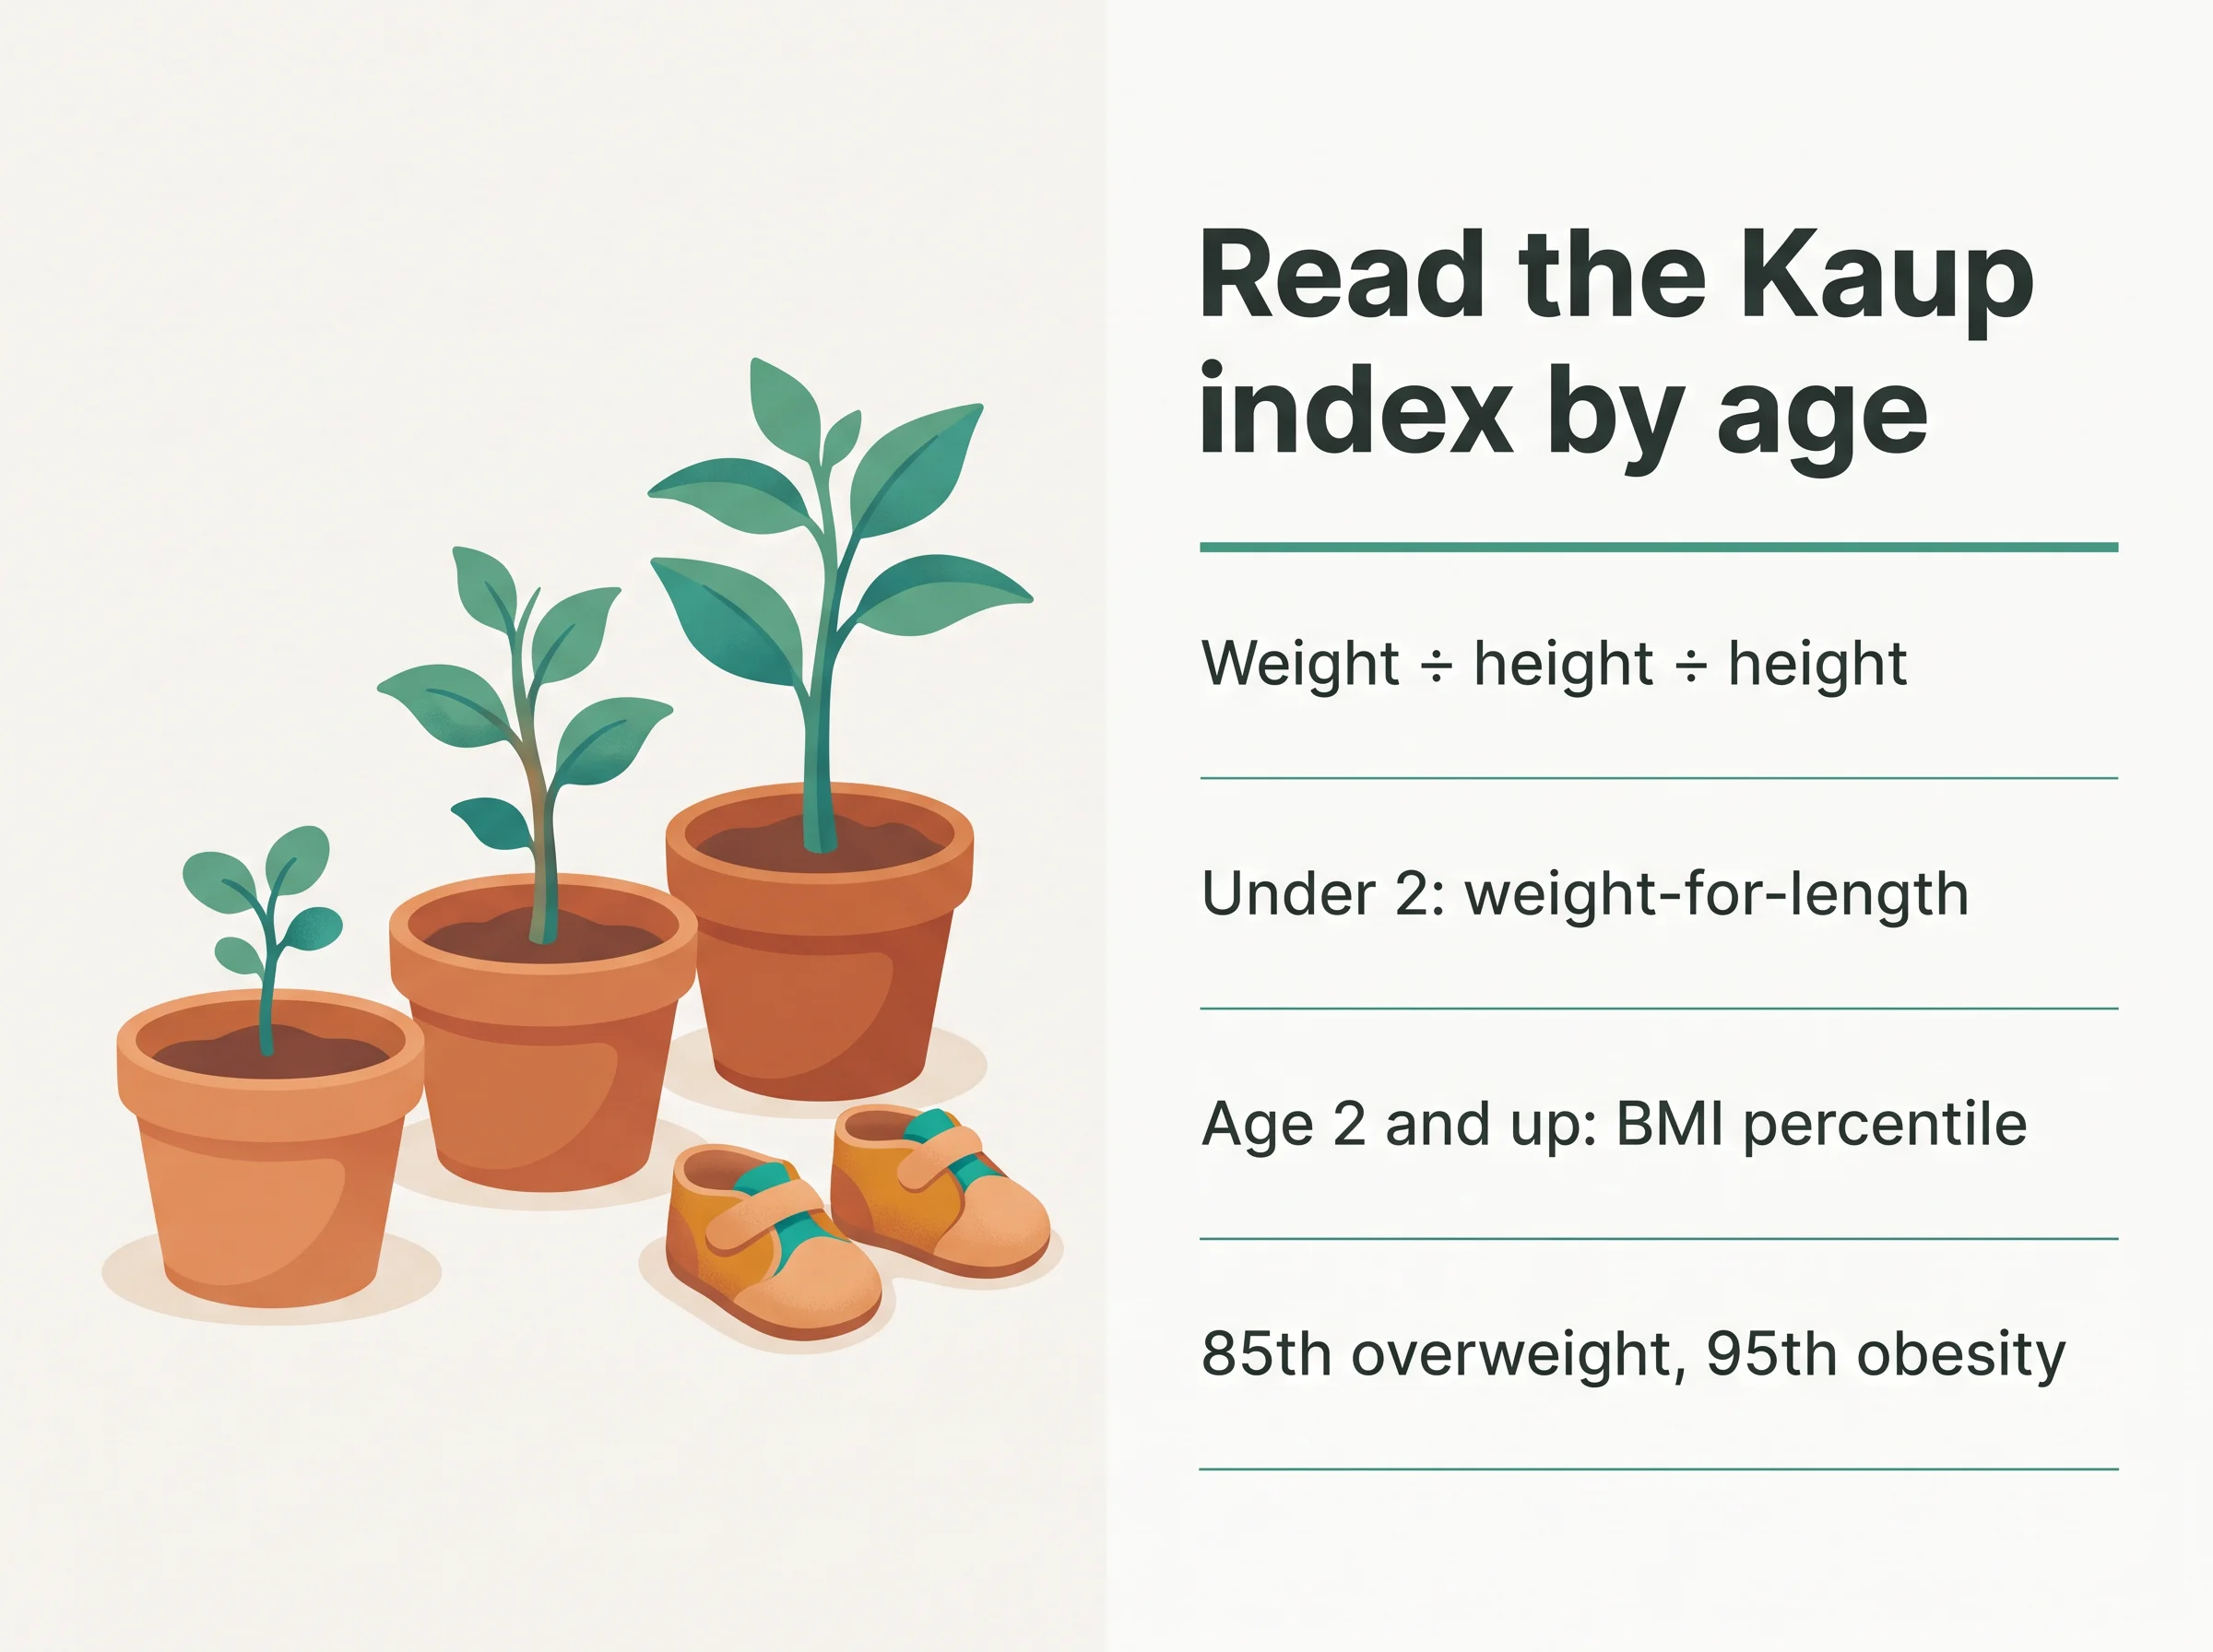
Under Age 2: Weight-for-Length, Not BMI
CDC recommends the WHO Child Growth Standards for children from birth to 2 years. The WHO standards do include a BMI chart from birth, but CDC does not recommend the BMI-for-age chart before age 2, because there is little research on what a BMI calculated from lying-down length means in infancy.
Instead, your pediatrician plots weight-for-length:
- High weight-for-length: above the 98th percentile for age and sex
- Low weight-for-length: below the 2nd percentile
What matters most in the first two years is whether weight keeps following its curve over a series of measurements. You can check daily weight gain from two weigh-ins with our baby weight gain calculator, and our growth chart guide explains how to read percentiles.
💡 If your baby looks chubby, don't cut back feeds on your own. Bring your concerns and the growth chart to your pediatrician first.Age 2 and Up: BMI-for-Age Percentile
From age 2, CDC growth charts compare your child's BMI with children of the same age and sex.
| BMI-for-age percentile | Category |
|---|---|
| Below the 5th percentile | Underweight |
| 5th to below the 85th percentile | Healthy weight |
| 85th to below the 95th percentile | Overweight |
| 95th percentile or above | Obesity |
| 120% of the 95th percentile or above | Severe obesity |

Source: CDC, Child and Teen BMI Categories (ages 2 through 19).
CDC's Child and Teen BMI Calculator works out the percentile for children 2 and older, but it is not a substitute for your pediatrician's assessment.
Watch the Trend, Not One Number
CDC notes that growth monitoring is based on a series of accurate measurements over time, not a single reading. A toddler's BMI normally drifts down after the first year, so a percentile that keeps climbing from one checkup to the next is worth discussing, just as one that keeps falling is.
If your child is in the overweight range, CDC suggests changes the whole family can make:
- Eat a varied pattern of real foods together as a family
- Swap sugary drinks for water or plain milk
- Keep children aged 3 to 5 physically active throughout the day
- Aim for 10 to 13 hours of sleep a day, naps included, for preschoolers
- Replace some screen time with family time
- Talk with your pediatrician, who may refer you to a family healthy weight program
When to Talk to Your Pediatrician
- Under 2: weight-for-length above the 98th percentile or below the 2nd percentile
- Age 2 and up: BMI at or above the 85th percentile, or below the 5th percentile
- Percentiles that shift by two or more lines between checkups
Track Your Child's Growth with BebeSnap
Logging height and weight regularly lets you read the trend instead of a single number.
- Growth Tracker: Enter weight, length or height, and head circumference to build growth charts
- Growth Trends: See how measurements change over time
- Checkup Ready: Have your records ready for well-child visits
👉 Learn more about BebeSnap Growth Tracking
Frequently Asked Questions (FAQ)
Q: What is a normal Kaup index for a baby?
A: There is no single normal value, because it changes with age. On the WHO standards the median peaks around 6 months (17.3 for boys, 16.9 for girls) and falls to about 15.2 to 15.3 by age 5. Under 2, pediatricians use weight-for-length instead; from 2, a BMI between the 5th and 85th percentile is a healthy weight.
Q: Is a Kaup index of 18 too high?
A: It depends on age. At 6 months, 18 sits a little above the middle (67th to 75th percentile) and is nothing to worry about, while at 18 months it is around 7th to 9th from the top of 100 children. From age 2, check the BMI percentile: the 85th and above is overweight and the 95th and above is obesity.
Q: My baby is under 1 and seems chubby. Should I feed less?
A: CDC does not recommend judging babies under 2 by BMI; pediatricians plot weight-for-length and treat above the 98th percentile as high. Rather than cutting back feeds on your own, ask your pediatrician whether your baby's weight is following its curve over several measurements.
Q: Is the Kaup index the same as BMI?
A: Yes, the formula is the same: weight in kilograms divided by height in meters squared. "Kaup index" is the name used mainly in Japan for infant and toddler BMI. In the US, BMI is read as a percentile for age and sex from age 2, and CDC's Child and Teen BMI Calculator gives that percentile.
Q: What should we do if our toddler is in the overweight range?
A: CDC suggests family-wide habits rather than a diet for the child: eat a varied pattern of real foods together, swap sugary drinks for water or plain milk, keep preschoolers active through the day, aim for 10 to 13 hours of sleep including naps, and cut back screen time. Your pediatrician can also refer you to a family healthy weight program.
References
Keep Every Growth Milestone
Log height, weight, and milestones. The growth curves are drawn for you.
See what the app does firstYou Might Also Like
Tomato for Babies: When to Start, Skin and Seeds, and Why Cherry Tomatoes Are Never Served Whole
Apple for Babies: Stage-by-Stage Portions and When Raw Apple Is Safe
Spinach for Babies: When to Start, Why Boiling Matters, and When to Skip It
Potato for Babies: When to Start, Safe Shapes, and Why Never to Blend It
You Might Also Like

Wonder Weeks Calculator: Your Baby's 10 Mental Leaps From the Due Date
Enter your due date and get all 10 leap dates. They land at weeks 5, 8, 12, 19, 26, 37, 46, 55, 64 and 75, each lasting 1 to 2 weeks.

Kawasaki Disease in Babies | When a Fever Won't Break After 5 Days
If your child's fever lasts 5+ days despite fever reducers and you see red eyes, strawberry tongue, rash, or swollen hands, it could be Kawasaki disease. Here's why to see a doctor right away.
Baby Weight Gain Calculator: Grams Per Day From Two Weigh-Ins
Enter two weigh-ins and get the gain per day. The guide is 25-30g a day at 0-3 months, 15-20g at 3-6 months, and 10-15g at 6-12 months.